60+ Essential Web Design Statistics You Need to Know in 2024

This is a collection of the most recent web design statistics.
If you want to see stats on:
- Responsive & Mobile Web Design
- Modern Web Design
- Web Design Industry & Growth
- On-Page Web Design
- Ecommerce Web Design
- Website Speed + Loading Time
You’ll love the updated stats in this post.
Web design is an essential component of any website or mobile app. These statistics provide insights into the key web design trends that can help designers and developers as they create sites. Understanding factors like website speed, design complexity, and accessibility compliance can inform better design decisions.
So without further ado, let’s get right into the latest stats!
Table of Contents
- Web Design Statistics at a Glance
- Responsive & Mobile Web Design Statistics
- 1: Over Half of the Web Traffic Stems From Mobile
- 2: Mobile-friendliness boosts brand perceptions
- 3. Mobile experience influences purchasing decisions
- 4. A third of small businesses have mobile apps
- 5. Mobile majority demand speedy site loading
- 6. Clunky mobile UX deters recommendations
- 7. App-free mobile sites preferred
- 8. Mobile load time directly impacts conversions
- 9. Google favors mobile-first indexing
- Modern Web Design Statistics
- 10. 59% prefer well-designed sites
- 11. 94% of first impressions tied to design
- 12. The average cost of $3,200 for the basic site
- 13. 0.05 secs to form an opinion
- 14. 50% say design is a priority
- 15. 75% form opinions on design
- 16. 2/3rds prefer beautifully designed content
- 17. 38.5% say outdated design drives exit
- 18. Over 1.9 billion websites exist
- 19. 73% trust business site info most
- Web Design Industry Statistics and Trends
- 20. Rapid job growth continues
- 21. Services market now $40.8 billion
- 22. Diy website builders, a $24 billion industry
- 23. Median pay over $77,000
- 24. Custom WordPress sites range $3k – $15k
- 25. 0.7% deliver websites in one month
- 26. WordPress powers 43% of sites
- 27. WooCommerce leads the plugin market
- 28. Elementor Ranks Top Site Builder
- 29. Over 200K U.S. Web Design Jobs by 2030
- On-Page Web Design Statistics
- 30. Photos, colors, and videos rank high
- 31. 22% want eye-catching colors
- 32. Hero images viewed 5.94 seconds
- 33. ‘Flat design’ leads styles
- 34. Homepages need calls-to-action
- 35. 51% want more contact information
- 36. Crowded sites are deemed the top mistake
- 37. 80% of attention falls left
- 38. 2d visuals & grid structures define flat design
- 39. Most small sites lack homepage CTAs
- Ecommerce Web Design Statistics
- 40. 21% of cart abandonments are due to complicated checkout
- 41. 60% say usability is the most important ecommerce site feature
- 42. Slow sites cost $2.6 billion in lost revenue
- 43. 23% of small retailers don’t have a website
- 44. 24% don’t have a site because they don’t know how
- 45. 85% say product info and images influence purchases
- 46. 78% want more product images
- 47. 90% will continue shopping with great UX
- 48. Over 50% of sales from mobile
- 49. Larger photos increase sales by over 9%
- Website Speed and Loading Time Statistics
- 50. 85% of pages load slower than 5 seconds
- 51. Nearly 50% refresh if the loading exceeds 3 seconds
- 52. 70% less willing to buy from slow sites
- 53. Over 50% prefer fewer media for faster loads
- 54. 50% longer sessions with 5-second loads
- 55. Slow loads increase cart abandonment by 29.8%
- 56. 57% of time spent above the fold, 74% on top screens
- 57. The top site’s median load time is 10 seconds
- 58. Original photos see 35% higher conversions
- 59. 123% higher bounce rate with 10-second loads
- Bonus: General Web Design Facts
- Keeping Up with the Future of Web Design
- Summary
- FAQs
Web Design Statistics at a Glance
Web design is crucial for attracting and maintaining attention on the ever-changing internet. The appearance and functionality of a website significantly influence user engagement. To stay updated, it is important to be aware of the latest trends and insights.
In this collection, you will find key statistics for creating a successful website, covering everything from first impressions to conversion rates. By utilizing these statistics, you can effectively grab attention and maximize your website’s performance.
With 1.9 billion websites competing, it is essential to get the fundamentals right. Discover key statistics that will inform your web design and enhance your online presence!
- 94% of first impressions are related to your site’s web design. (WebFX, 2021)
- 73% of companies invest in design to help their brand stand out from competitors (HubSpot, 2023)
- 89% of consumers shop with a competitor after a poor user experience (WebFX, 2023)
- Slow-loading websites lead to a $2.6 billion revenue loss each year (Unbounce, 2023)
- 75% of people form their opinion of a website based on its design. (PR Newswire, 2021)
- Given 15 minutes to consume content, 2/3rds of people would rather read something beautifully designed than something plain, according to Adobe. (Adobe, 2023)
- 38.5% of web designers believe that outdated design is a top reason why visitors leave a website. (GoodFirms, 2023)
- First impressions of websites are 94% related to design (Research Gate, 2023)
- The average cost of designing a basic website is $3200 (GoodFirms, 2023)
- It takes 0.05 seconds for users to create an opinion about your website (Behaviour and Information Technology, 2023)
Responsive & Mobile Web Design Statistics
With mobile dominating global web traffic and consumer preferences, creating an exceptionally responsive and mobile experience is essential. If you want website visitors who browse, buy, and engage, these critical mobile stats will help you benchmark your optimization efforts.
From load times and mobile-friendliness to app and recommendation potential, these data-driven insights distill exactly what resonates with the mobile majority. Read on to discover key strategies to win mobile users and outperform competitors lacking mobile mastery.
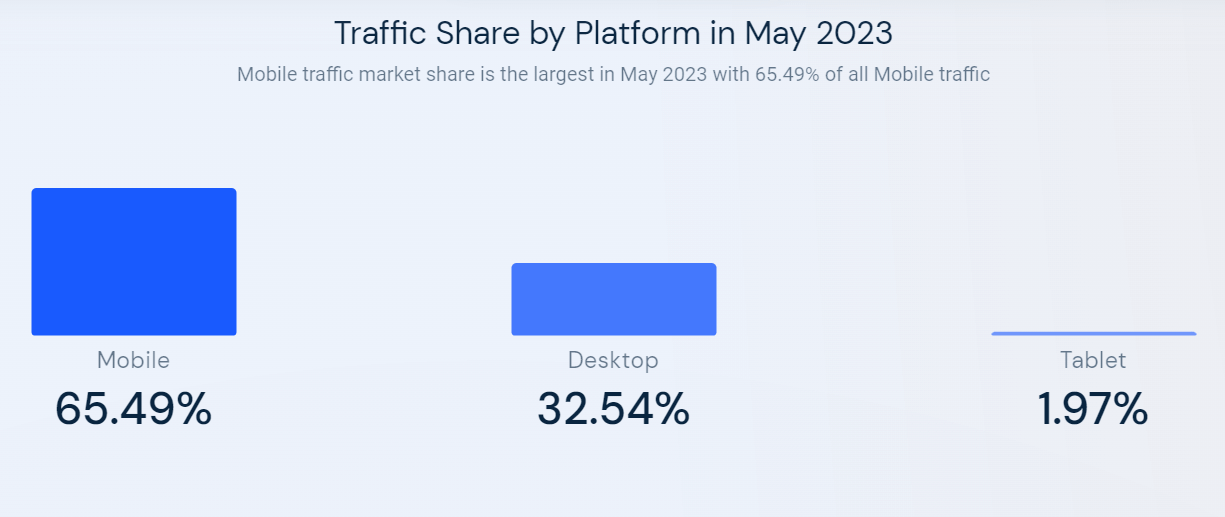
1: Over Half of the Web Traffic Stems From Mobile
(Source: SimilarWeb, 2023)
In May 2023, 65.49% of global website traffic originated from mobile devices, according to SimilarWeb data. With mobile’s majority share, an unoptimized mobile experience risks alienating over half your potential traffic. Failing to optimize for mobile means failing to engage with most site visitors, making responsive design not just ideal but mandatory.
2: Mobile-friendliness boosts brand perceptions
(Source: WebFX, 2023)
61% of internet users think more highly of brands with mobile-friendly web designs, reports WebFX. Positive perceptions can increase sales and recommendations, making mobile optimization a valuable branding asset. With impressions forming quickly, a site frustrating mobile users damages brand affinity. But get the mobile experience right, and watch brand sentiment skyrocket.

3. Mobile experience influences purchasing decisions
(Source: WebFX, 2023)
67% of users say they’re more likely to buy from sites that are easy to use on mobile, reveals WebFX. Since mobile drives most web traffic, ensuring mobile drives sales is also vital. Don’t just design mobile sites for browsing – make buying, checking out, and converting seamless mobile experiences.
4. A third of small businesses have mobile apps
(Source: Top Design Firms, 2021)
32% of small businesses already have mobile apps, and 42% plan to build one, according to Top Design Firms data. But variety remains–26% aren’t likely to ever release an app.
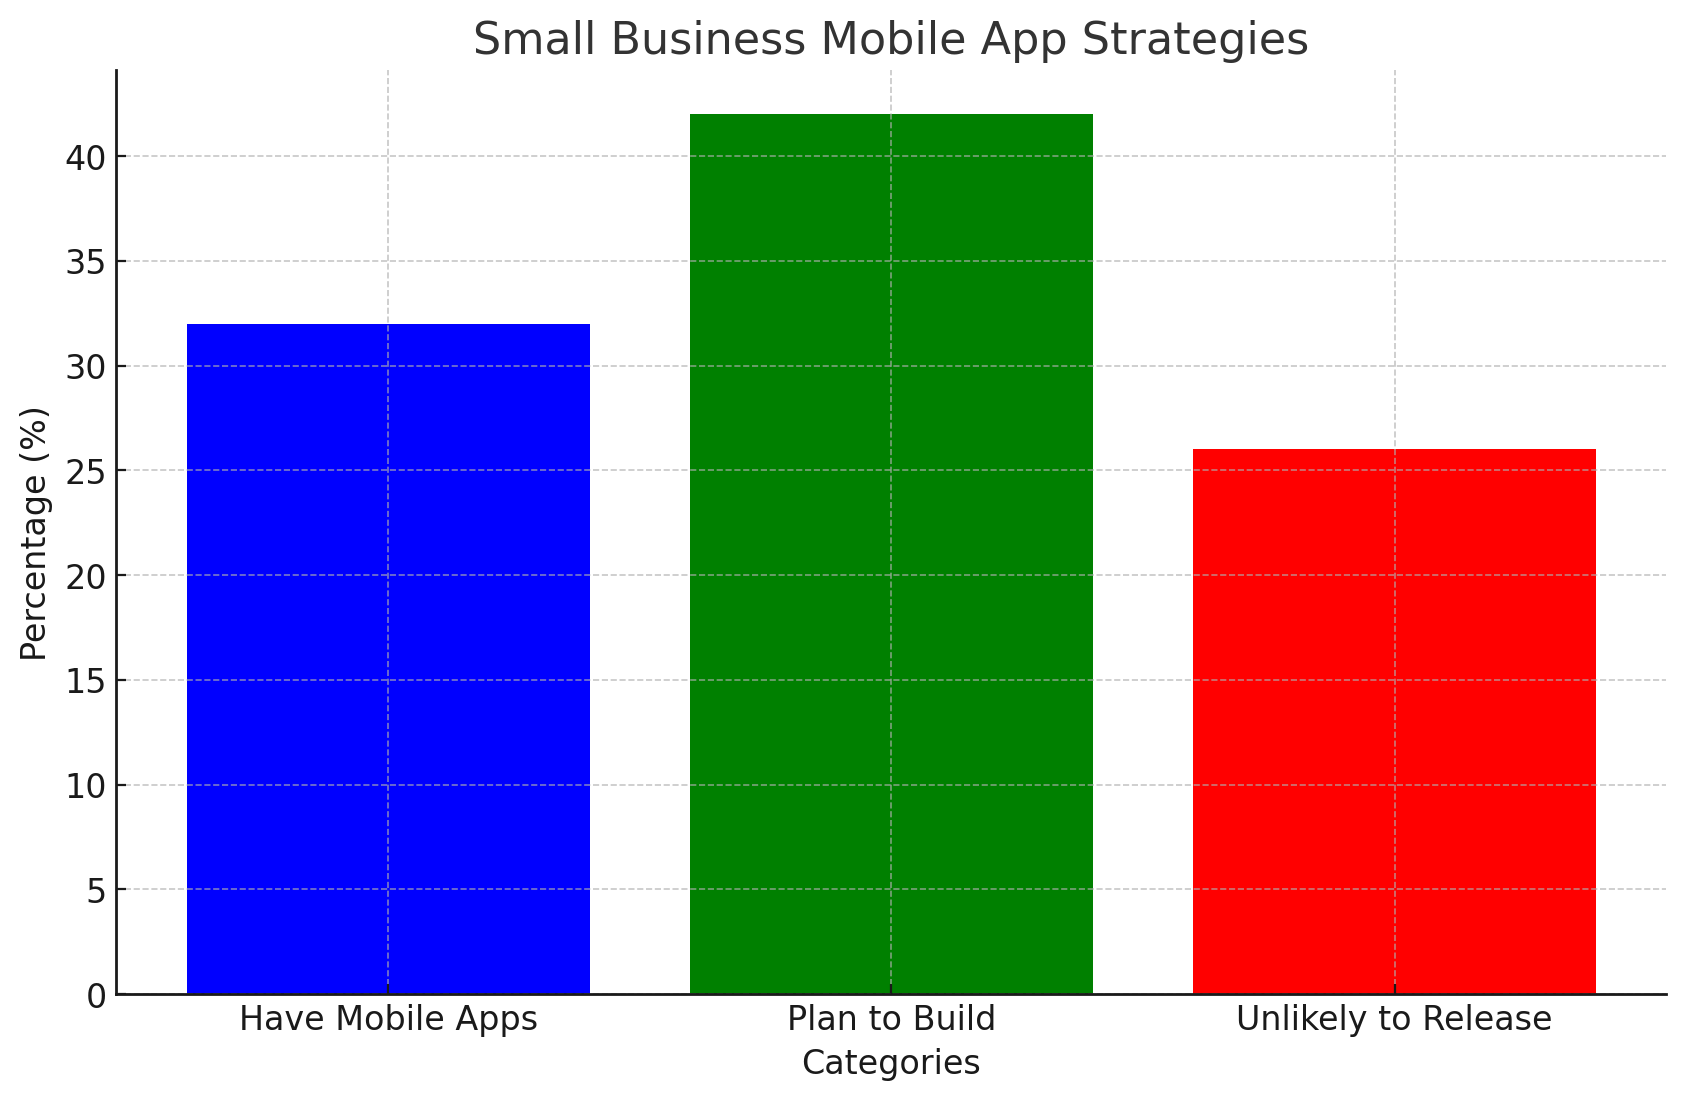
Know your mobile strategy. While a well-designed responsive site meets most mobile needs, apps provide a specialized experience that some businesses or industries may benefit from. But they also require separate development and marketing costs to leverage effectively.
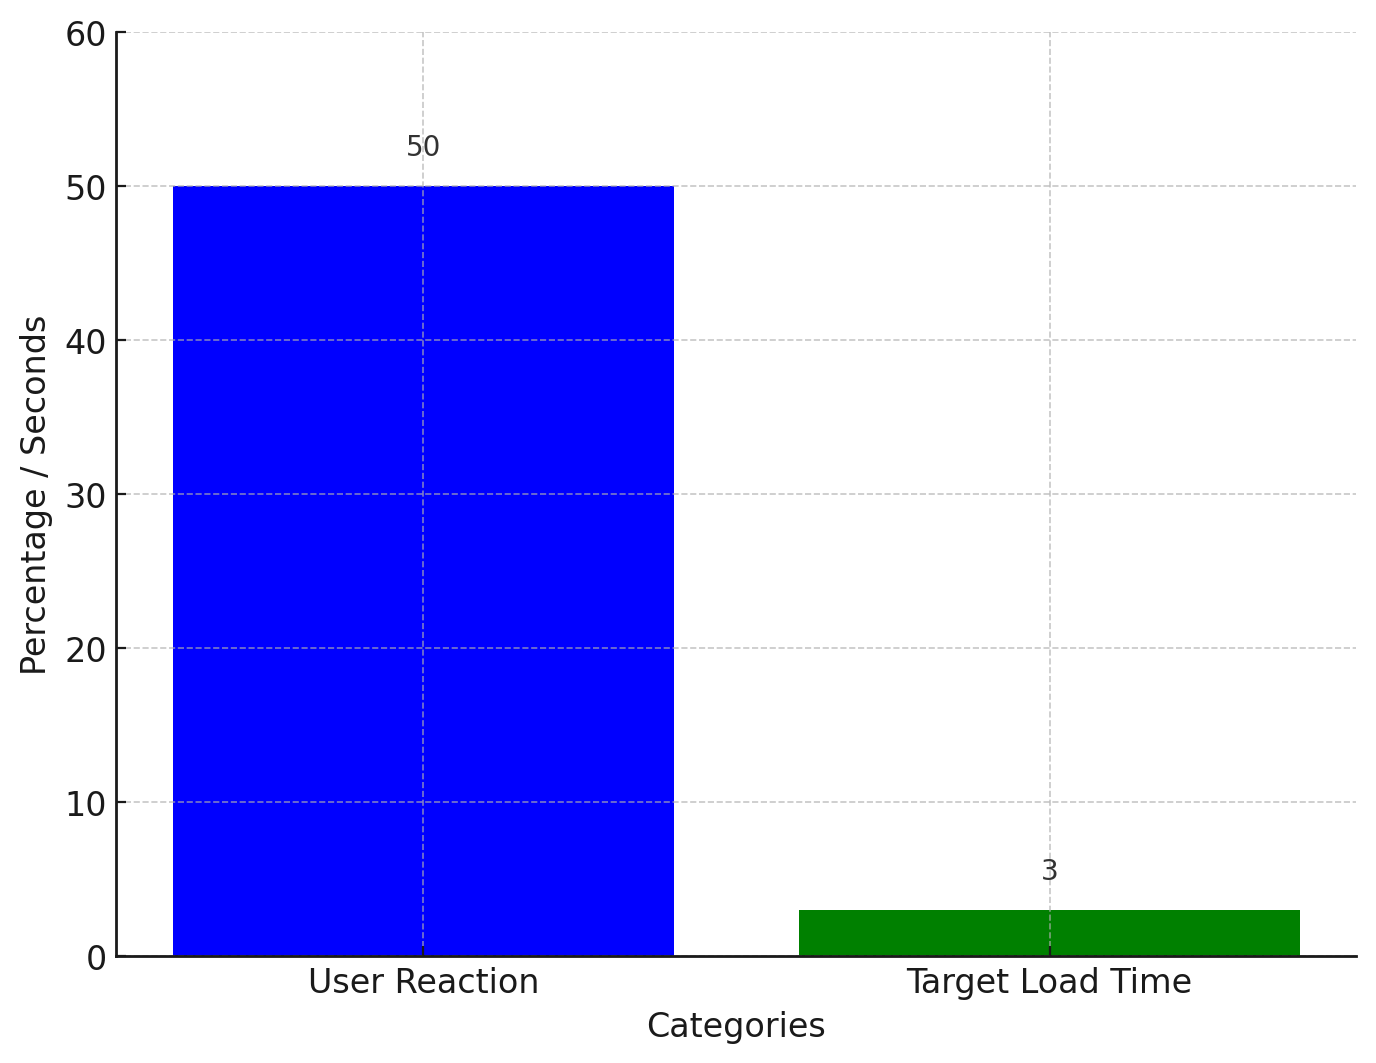
5. Mobile majority demand speedy site loading
(Source: Web Performance Guru, 2023)
Most mobile users expect sites to load fully in 3 seconds or less, per Web Performance Guru. With little patience for lagging sites, fast page speeds are mandatory for mobile. And 50% will refresh pages taking over 3 seconds, warns Unbounce data. Delivering engaging mobile UX requires investing in site speed – from code optimization to content compression, faster is better.
6. Clunky mobile UX deters recommendations
(Source: WebFX, 2023)
57% of internet users say they won’t recommend a business with a poorly designed website on mobile per WebFX. And 96% have encountered sites clearly not designed for mobile finds Invespcro. With reputation influencing purchases, bad mobile UX means lost sales as users flock to sites meeting mobile expectations.
7. App-free mobile sites preferred
(Source: Top Design Firms, 2021)
50% of smartphone users are more likely to use a company or brand’s mobile site when browsing on a smartphone because they don’t want to download an app according to Top Design Firms. While offering an app provides benefits, a robust, responsive site remains most mobile users’ preferred destination.
8. Mobile load time directly impacts conversions
(Source: Google, 2023)
Decreasing mobile site load times by just one-tenth of a second resulted in major increases in conversion rates, reports Google. With impatience for lagging sites, fractions of seconds can determine if mobile visitors stay to transact or leave for faster competitors.
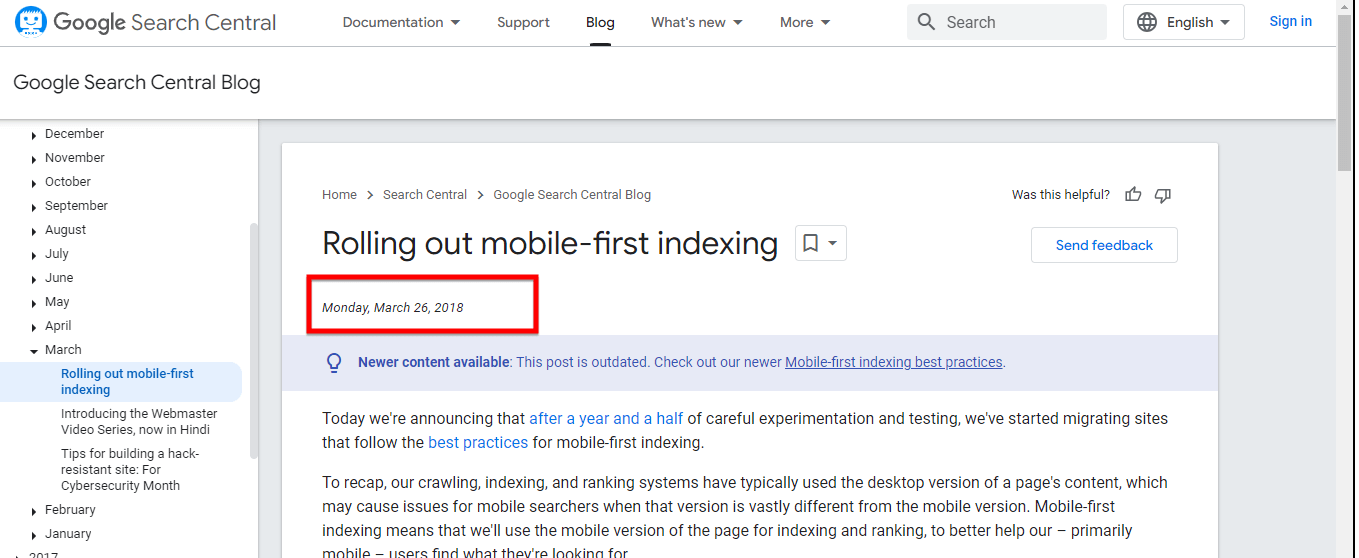
9. Google favors mobile-first indexing
(Source: Google, 2018)
Google introduced worldwide mobile-first indexing in 2018, primarily using the mobile version of content when ranking webpages in search results. With mobile driving queries and clicks, an under-optimized mobile experience harms organic visibility and traffic potential.
Modern Web Design Statistics
Web design is more than just a pretty face on the internet. In fact, it’s a crucial part of how we experience the digital world. It’s not just about making a site look cool; it’s also about how easy and fun it is for us to use.
The more we enjoy a site, the more likely we are to return or take actions like buying a product or signing up for information. This is where modern web design statistics come in. I put together these stats so we can understand what works and what doesn’t in web design today.
Using these stats is like using a helpful tool that can guide us in keeping our websites interesting and engaging. Together, let’s dive into these stats and see how web design influences our daily digital interactions.
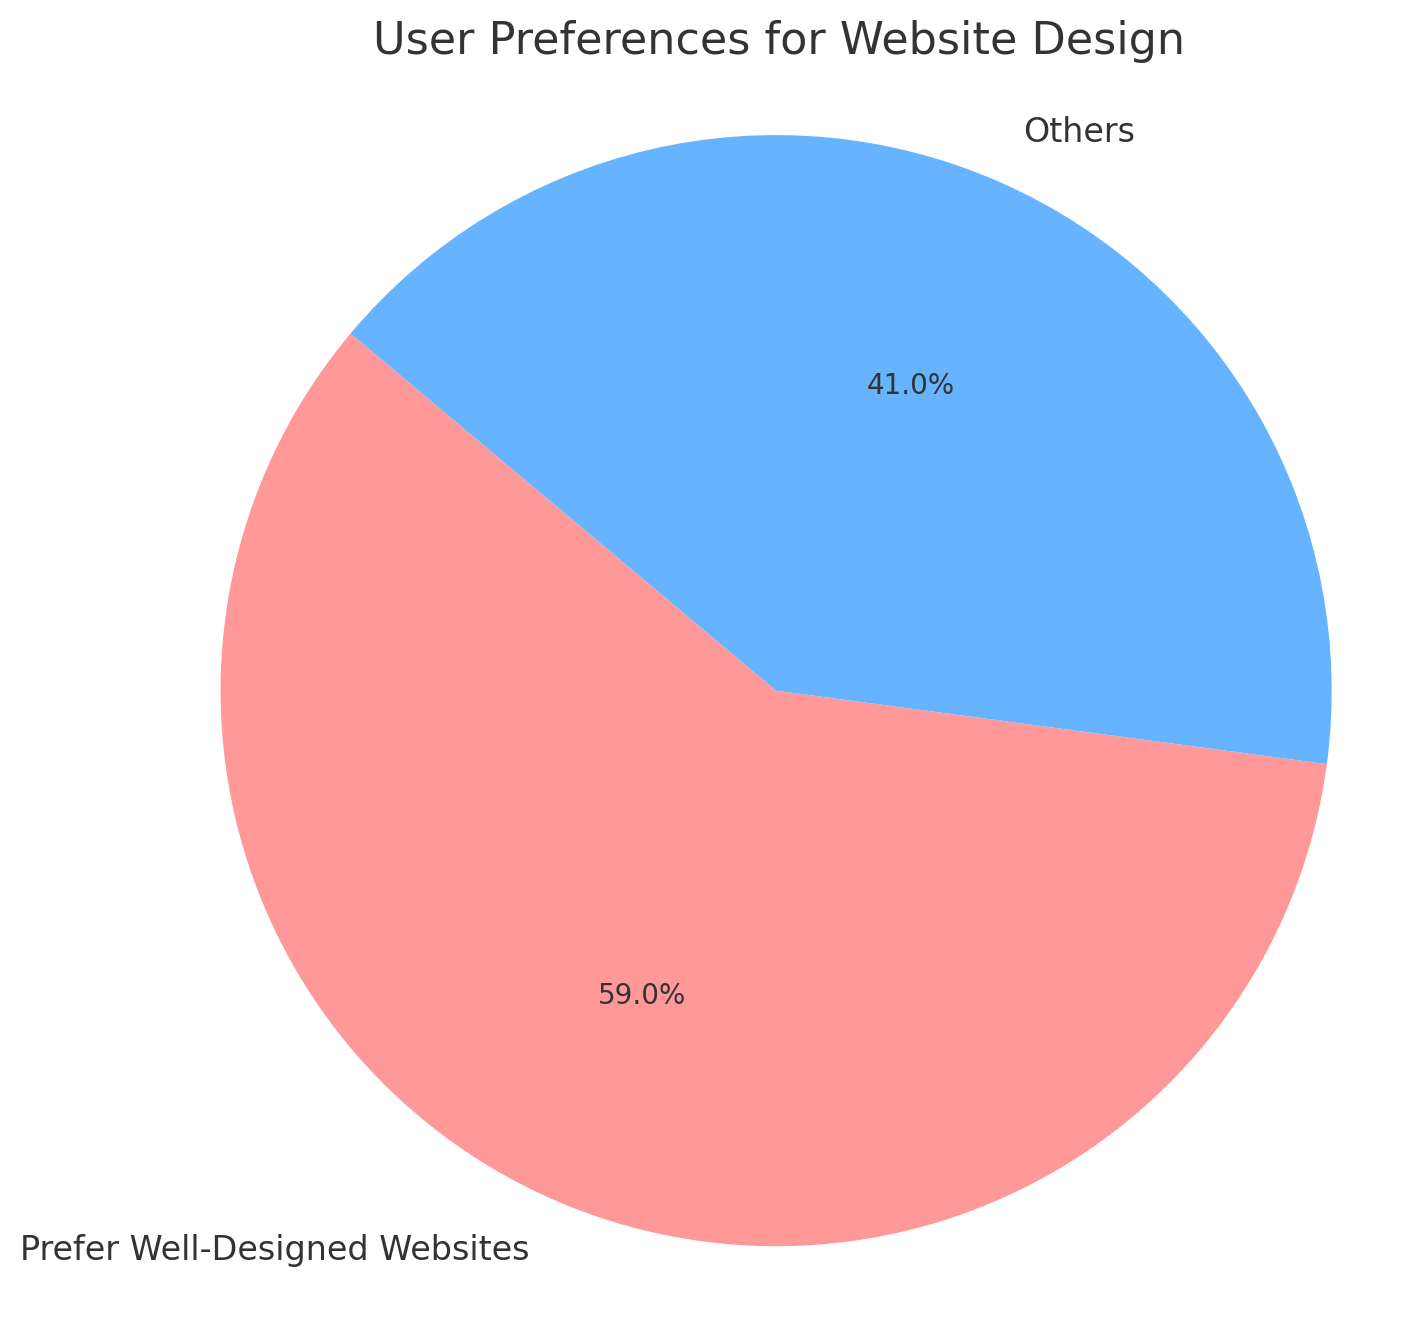
10. 59% prefer well-designed sites
(Source: Adobe, 2023)
Over half of internet users, according to Adobe, 59% to be exact, prefer aesthetically pleasing, well-designed websites over basic, plain sites. This highlights and reinforces the critical need for thoughtful and appealing visual design in web development and layouts. Well-designed interfaces foster far more engagement.
11. 94% of first impressions tied to design
(Source: Research Gate, 2023)
The visual design of a website plays a massive role in the crucial first impressions it makes, with 94% of first impressions related to website design alone, according to Research Gate data. This emphasizes the climactic importance designers carry to make sites visually striking straight from the initial view for visitors. Appeal holds great sway.
12. The average cost of $3,200 for the basic site
(Source: GoodFirms, 2023)
Getting professional web design work done costs, on average, $3,200 for a basic, starter informational website, according to recent data collected by GoodFirms. More sophisticated sites with extensive functionality, features, and customization can often cost agencies much more overall. Budgets scale up.
13. 0.05 secs to form an opinion
(Behaviour and Information Technology, 2023)
Incredibly quickly, in just 0.05 seconds, visitors arriving at a new website start forming instant opinions about what they see, according to pivotal research published in Behaviour and Information Technology last year. This reveals and cements how extraordinarily vital first-glance visual appeal is for sites seeking to engage audiences. Speed impresses fast judgments.
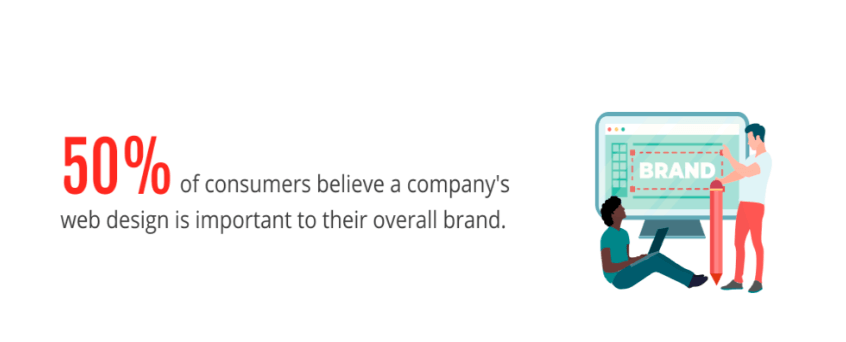
14. 50% say design is a priority
(Source: PR Newswire, 2021)
Half of consumers, 50% specifically according to the PR Newswire study, believe that brands today should actively prioritize website design and make it a higher focus moving forward. This user sentiment demonstrates the value of design.
15. 75% form opinions on design
(Source: PR Newswire, 2021)
A significant majority, 75% of people surveyed per PR Newswire, form initial judgments about a website based predominantly on its visual design and layout when first interacting with pages. This further highlights why strong UX and UI design matters.
16. 2/3rds prefer beautifully designed content
(Source: Adobe, 2023)
Given just 15 short minutes to consume content, a full 2/3rds of visitors, according to recent 2023 research by Adobe, would rather read something presented in a beautifully designed way over something very plain. Design grabs attention.
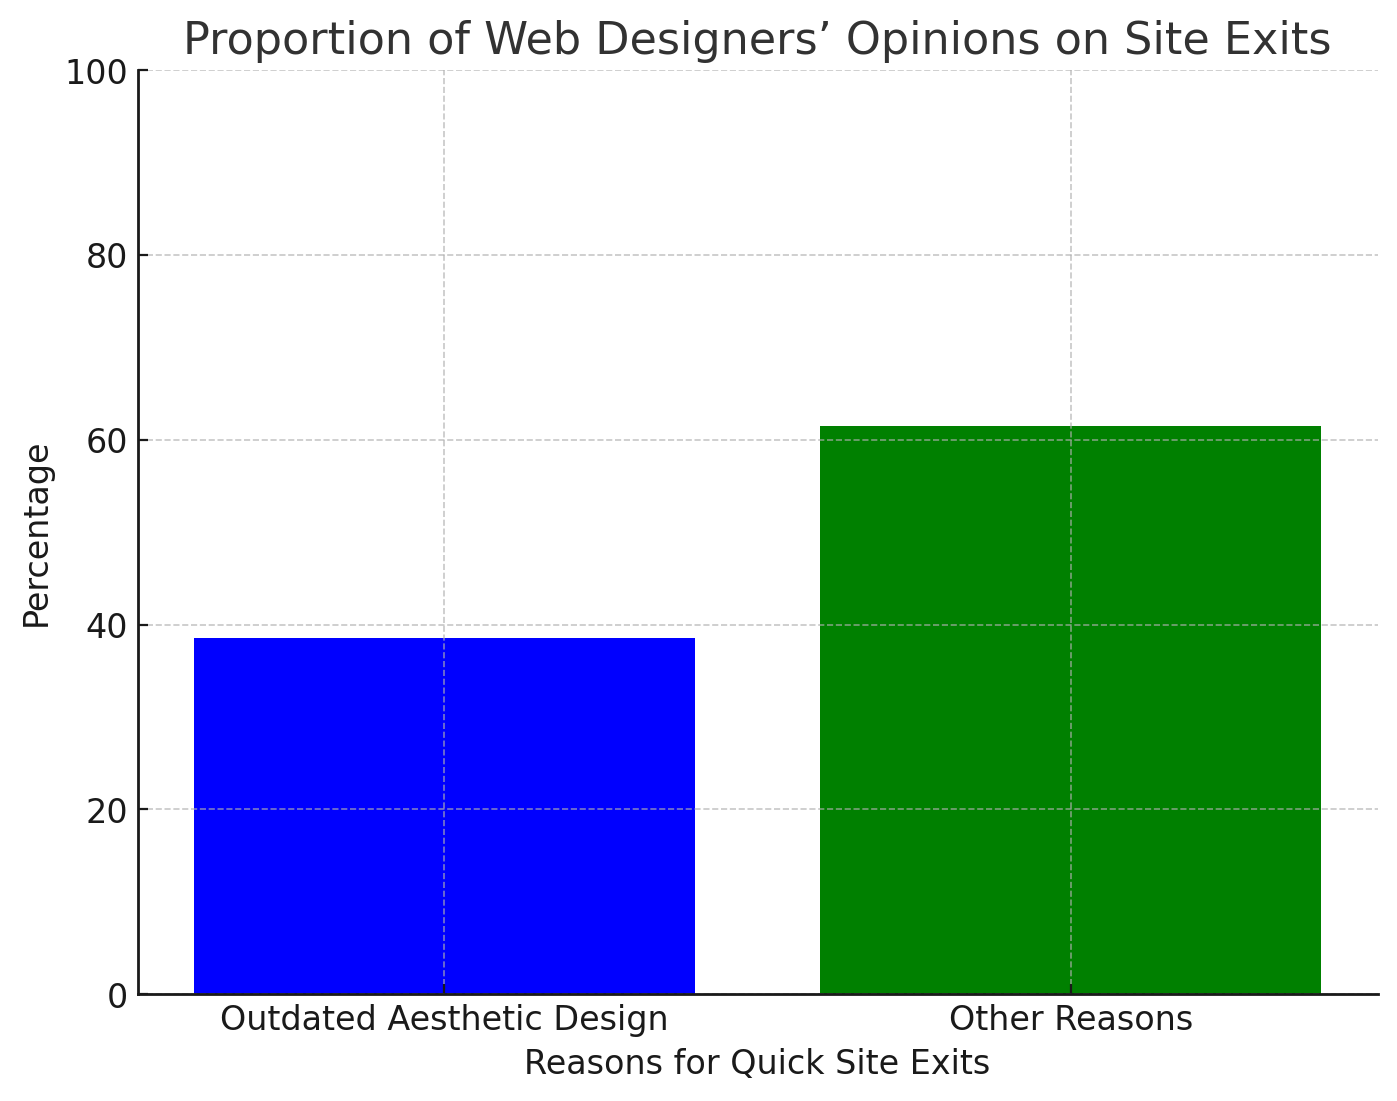
17. 38.5% say outdated design drives exit
(Source: GoodFirms, 2023)
Over a third, 38.5% to be precise, of professional web designers believe outdated aesthetic design is one of the top reasons why visitors leave a website quickly, according to 2023 GoodFirms data. Keeping layouts current sustains traffic.
18. Over 1.9 billion websites exist
(Source: Internet Live Stats, 2023)
The expansive scale of the internet is evident in data showing there are now over 1.9 billion websites active across the online world, according to 2023 figures published by Internet Live Stats. The web’s breadth enables huge audiences.
19. 73% trust business site info most
(Source: BrightLocal, 2023)
Demonstrating the influential capacity websites hold, a true majority 73% of consumers trust the information presented on a company’s owned website over other sources, according to 2023 BrightLocal research. This highlights the value of content.
Web Design Industry Statistics and Trends
See how web design has changed over time and what the future might hold. Together, we’ll focus on important aspects like how big the market size is and what job prospects look like.
You can use this information to compare with your own business and find promising opportunities. Keep reading to see how the need for web design, the average Pay, and the use of platforms like WordPress and WooCommerce have increased.
20. Rapid job growth continues
(Source: U.S. Bureau of Labor Statistics, 2021)
The U.S. had approximately 216,700 web developer and digital designer jobs in 2022, according to Bureau of Labor Statistics data. With an expected employment change of 34,700 positions from 2022 to 2032, the number of roles is projected to reach around 251,400 by 2032.
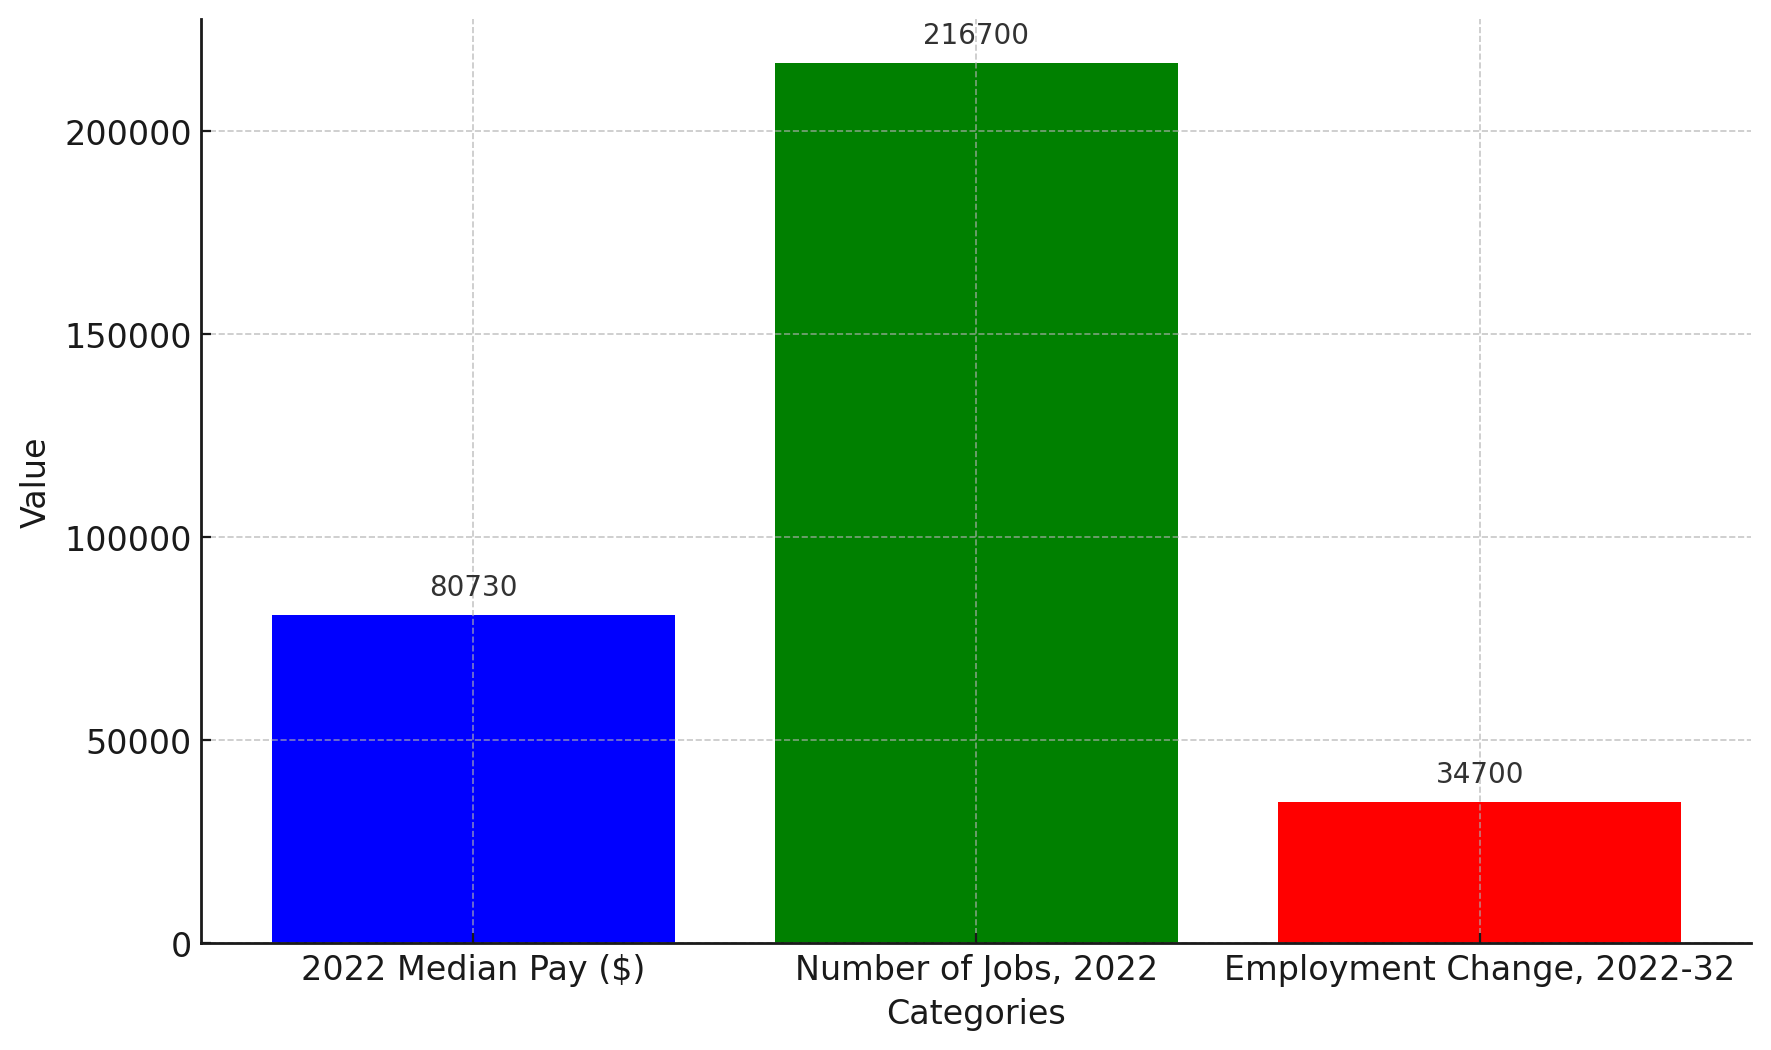
Driven by digital acceleration across industries, employment outlooks also remain strong, with a projected ten-year growth of 16%, which is much faster than average.
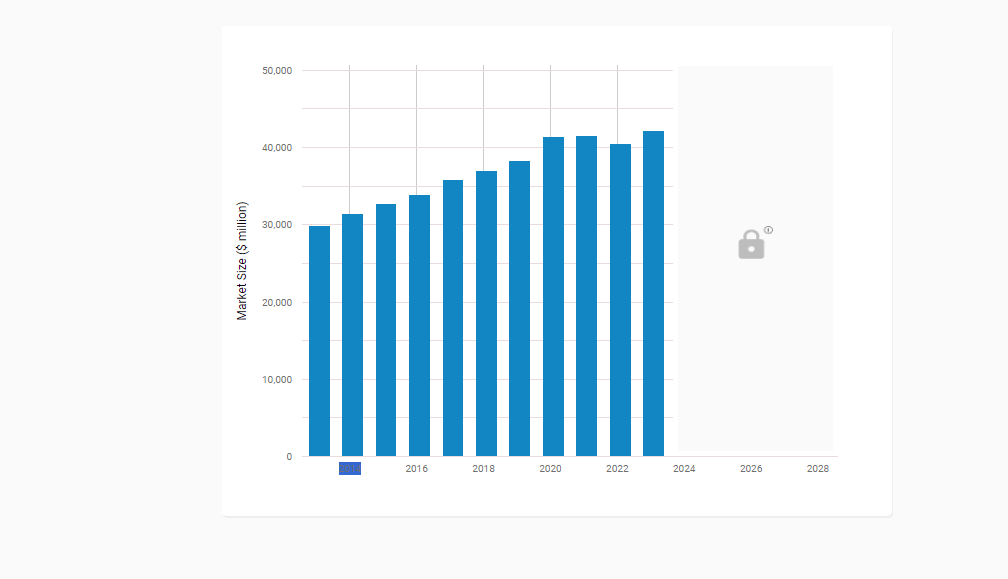
21. Services market now $40.8 billion
(Source: IBISWorld, 2023)
The American web design services market size reached $40.8 billion in 2022, according to IBISWorld analysis. Expanding over 3% annually in recent years, positive trends will continue with more digital transformation underway.
22. Diy website builders, a $24 billion industry
(Source: Toptal, 2023)
Do-it-yourself website creation suites have become a $24 billion market, states Toptal Research. With no coding expertise required, automated site builders expand web development accessibility.
23. Median pay over $77,000
(Source: U.S. Bureau of Labor Statistics, 2021)
Web developers and designers in America earn a median of $77,200 per year, according to 2020 stats from The Bureau of Labor Statistics. Those within the top 10% of high earners make over $146,000 annually, demonstrating high earning potential.
24. Custom WordPress sites range $3k – $15k
(Source: WPBeginner, 2023)
The typical price range for custom WordPress sites or theme projects is $3,000 to $15,000, says popular WordPress resource WPBeginner. With market share and developer know-how, WordPress dominates site builds.
25. 0.7% deliver websites in one month
(Source: GoodFirms, 2023)
80.7% of professional web designers complete basic website projects within 1 month, reports GoodFirms. With efficient workflows, most handle responsive site design and deployment expeditiously.
26. WordPress powers 43% of sites
(Source: W3Techs, 2023)
WordPress serves as the foundation for 43.1% of all websites currently find W3Techs tracking of content management systems. From blogs to news outlets and ecommerce stores, WordPress versatility drives adoption.
27. WooCommerce leads the plugin market
(Source: W3Techs, 2023)
WooCommerce is the most used WordPress plugin, with over 20% adoption, according to W3Techs. The leading ecommerce solution for WordPress, Woo empowers entrepreneurs globally.
28. Elementor Ranks Top Site Builder
(Source: W3Techs, 2023)
As the second most used WordPress plugin with over 15% adoption states W3Techs, Elementor tremendously facilitates custom site-building. With no coding skills required, the drag-and-drop page design expands website creation accessibility.
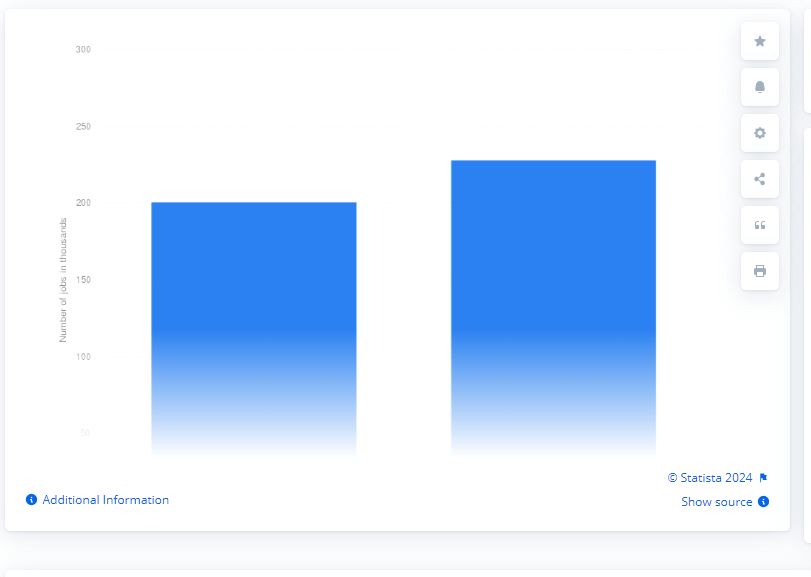
29. Over 200K U.S. Web Design Jobs by 2030
(Source: Statista, 2023)
Exceeding 200,000 employment roles in the American web design job market is projected by 2030, according to Statista projections. Positive growth trajectory remains thanks to digital immersion across sectors.
On-Page Web Design Statistics
When you visit a website, you quickly decide if you like it or not based on what you see. How you feel on the page makes you want it more, engage more, and buy something. These numbers show what parts of a website people like and why it’s important to know what users think.
Keep reading to learn what grabs people’s attention, the mistakes you should avoid, and how the best websites draw in their readers.
30. Photos, colors, and videos rank high
(Source: Top Design Firms, 2021)
Photos, images, colors, and videos are the visual webpage elements users value most, according to research by Top Design Firms. 40% favor photos, while 39% colors and 21% videos. Prioritize these high-impact visuals while crafting sites.
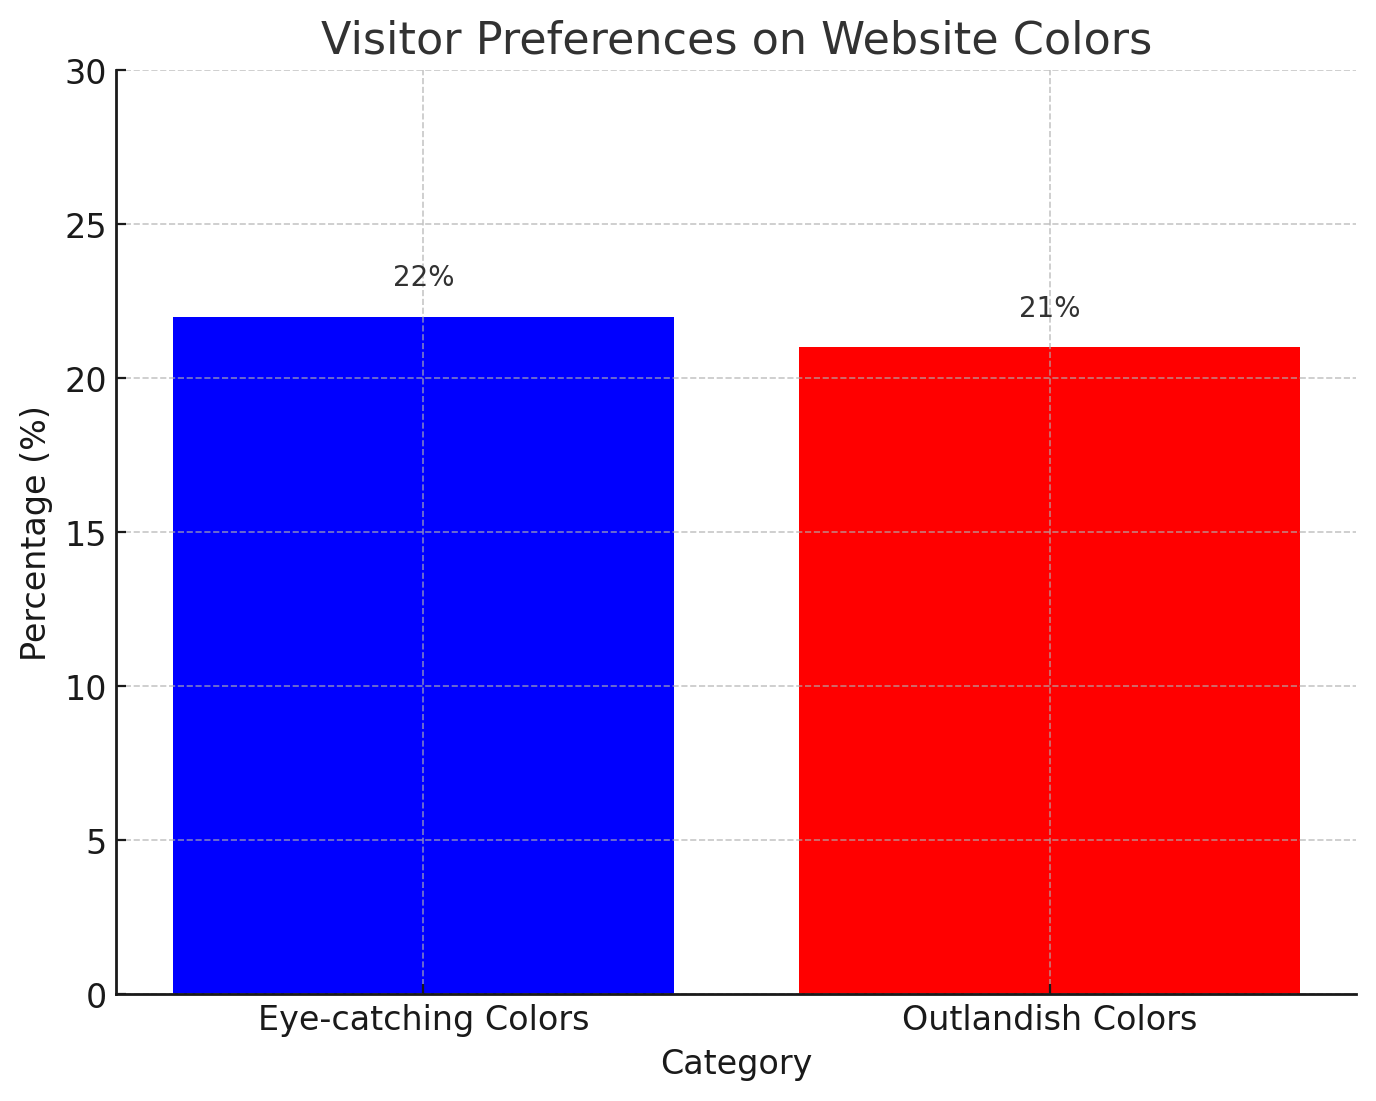
31. 22% want eye-catching colors
(Source: Top Design Firms, 2021)
Per Top Design Firms, 22% of people visiting sites look first for eye-catching colors, seeking visual excitement. However, around the same proportion (21%) leave sites with outlandish color schemes. Distinctive yet coordinated palettes strike an optimal balance.
32. Hero images viewed 5.94 seconds
(Source: CXL, 2023)
When landing on pages, visitors spend an average of 5.94 seconds viewing main images driving key messages, reports CXL. Compelling heroes with minimal text capture attention fast, allowing aesthetics to communicate first.
33. ‘Flat design’ leads styles
(Source: GoodFirms, 2023)
Currently, the most popular web design style is ‘Flat Design’ according to 88.5% of designers surveyed by GoodFirms. Flat’s simple, 2D-forward aesthetics focusing on utility over embellishments resonate today.
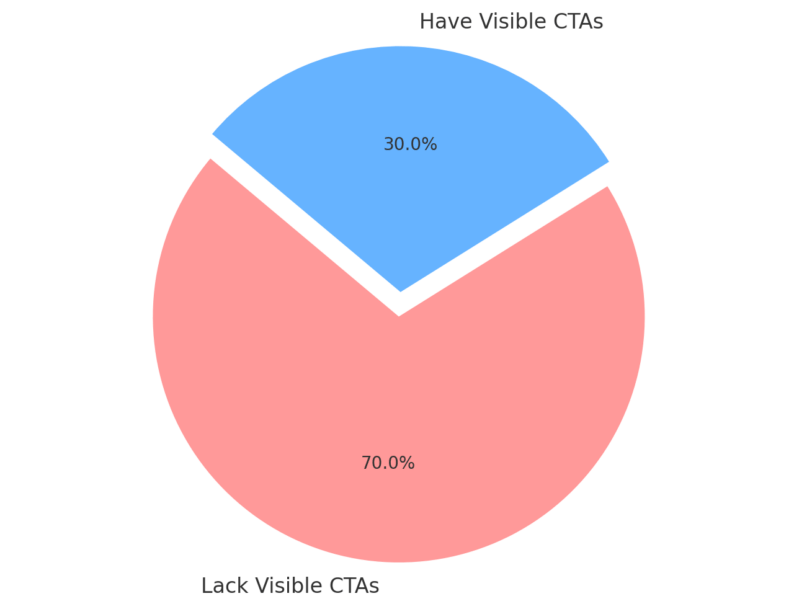
34. Homepages need calls-to-action
(Source: Small Biz Trends, 2023)
70% of small business homepages lack visible calls-to-action per Small Biz Trends. Without direction toward conversion goals, visitors’ next steps remain unclear. Prioritize simplifying user journeys through strategic CTAs.
35. 51% want more contact information
(Source: Small Biz Trends, 2023)
Over half (51%) think most company websites lack thorough contact information, according to Small Biz Trends. Multiple touchpoints like phone numbers, emails, and live chat build trust.
36. Crowded sites are deemed the top mistake
(Source: GoodFirms, 2023)
Per GoodFirms, 84.6% of designers surveyed believe overcrowded pages are the most common error small business websites commit. Overloading pages baffles users instead of guiding them.
37. 80% of attention falls left
(Source: NNGroup, 2023)
Analysis by NNGroup shows that 80% of viewing time concentrates leftward. Place vital elements like headlines strategically left to capture eyeballs. Optimize left-hand content.
38. 2d visuals & grid structures define flat design
(Source: GoodFirms, 2023)
The principal characteristic of the Flat Design approach is its focus on usability over ornamentation. Two-dimensional visuals and a strong grid structure define layouts. 88.5% of website designers turn to Flat principles.
39. Most small sites lack homepage CTAs
(Source: Small Biz Trends, 2023)
Per Small Biz Trends’ research, a staggering 70% of small business homepages have no call-to-action buttons or links present. Every site should direct visitors toward meaningful actions.
Ecommerce Web Design Statistics
Ecommerce continues to grow at a rapid pace. To stay competitive, ecommerce sites need to focus on providing the best user experience possible. The following statistics highlight key elements of ecommerce web design and their impact.
40. 21% of cart abandonments are due to complicated checkout
(Source: Dynamic Yield, 2023)
According to Dynamic Yield, 21% of online shopping cart abandonments are due to a complicated or lengthy checkout process. Streamlining the checkout process is essential to reducing cart abandonment. A complicated checkout process frustrates customers and causes them to abandon their purchases.
41. 60% say usability is the most important ecommerce site feature
(Source: Statista, 2020)
In a Statista survey, 60% of respondents stated that usability is the most important web design characteristic for online shopping. Ecommerce sites should prioritize intuitive navigation and processes. The usability of a site impacts conversion rates and customer satisfaction.
42. Slow sites cost $2.6 billion in lost revenue
(Source: Unbounce, 2023)
Per Unbounce, slow-loading ecommerce websites lead to $2.6 billion in lost sales every year. Optimizing page speed is key to increasing conversion rates. Slow load times lead shoppers to abandon a site before making a purchase. Fast sites provide a better user experience and lead to more sales.
43. 23% of small retailers don’t have a website
(Source: Digital, 2021)
Per Digital, 23% of small retail businesses do not have a website. Websites drive sales and brand awareness for retailers. Small businesses without an online presence miss growth opportunities. Building a website levels the playing field for small retailers to compete.
44. 24% don’t have a site because they don’t know how
(Source: Digital, 2021)
Additionally, 24% of small retailers without websites responded in a Digital survey that the reason was not knowing how to create or run one. There are many user-friendly website builders tailored for small businesses. With the right tools and education, creating an ecommerce site is accessible.
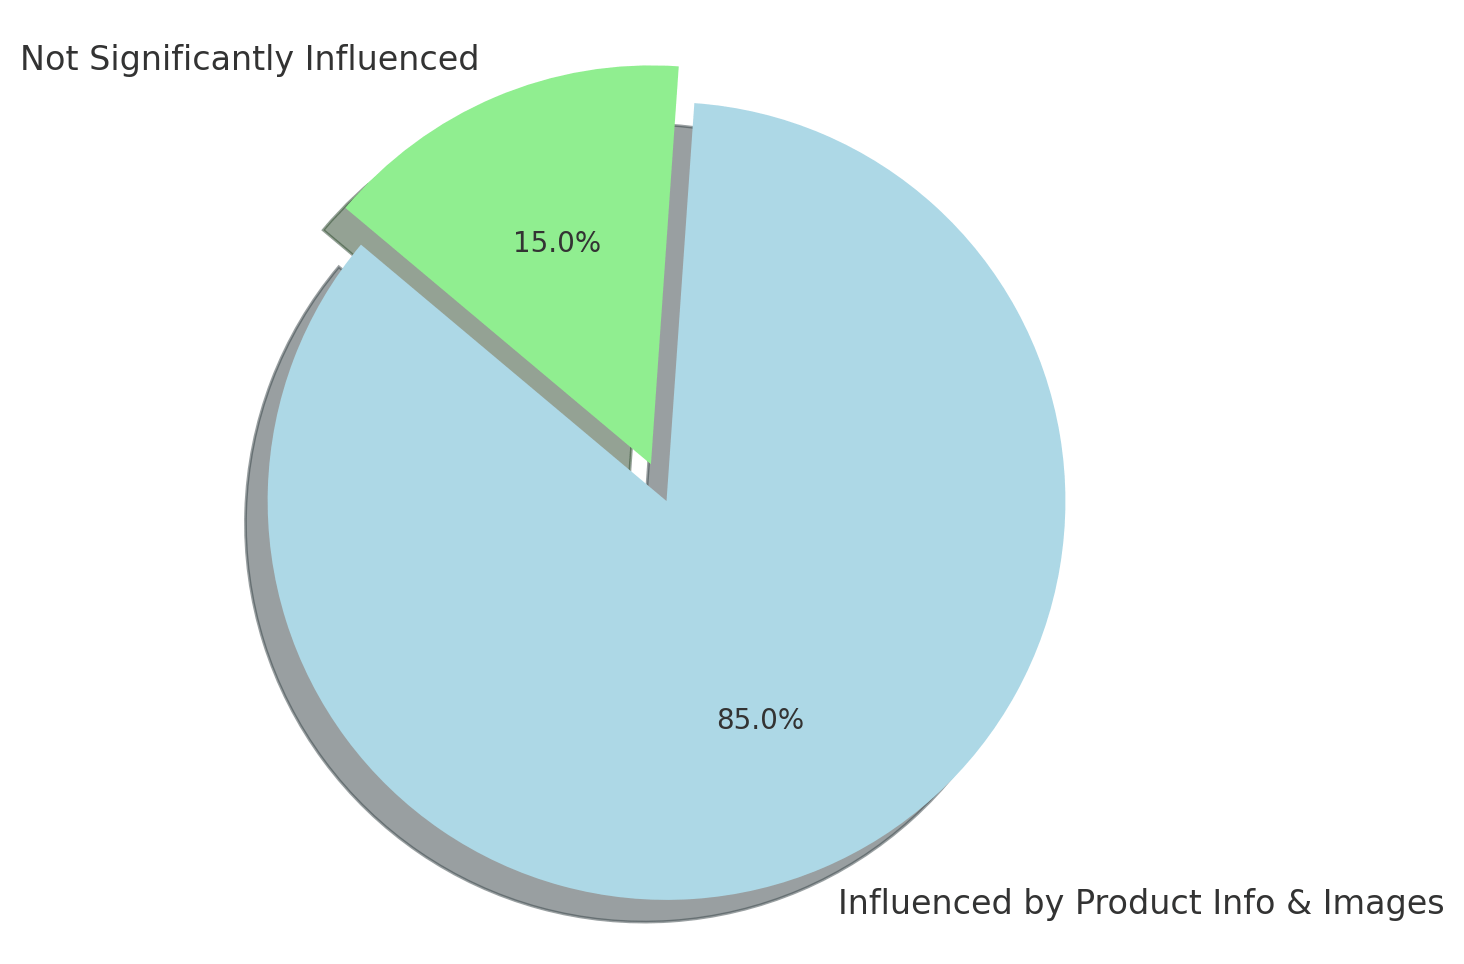
45. 85% say product info and images influence purchases
(Source: Meero, 2023)
A Meero survey found that 85% of shoppers say product information and images impact their decisions on where to purchase. High-quality product copy and images build trust and influence customers. Ecommerce sites should invest in compelling product content.
46. 78% want more product images
(Source: Meero, 2023)
78% of shoppers told Meero they want ecommerce sites to feature more product images. Multiple high-quality photos give customers a detailed look at products. More images can boost conversion rates.
47. 90% will continue shopping with great UX
(Source: WebFX, 2023)
Per WebFX, 90% of users report they will continue shopping at an ecommerce site because of a great user experience. Intuitive navigation and processes keep customers engaged. Sites should test and refine UX through research and analytics.
48. Over 50% of sales from mobile
(Source: Statista, 2021)
A 2021 Statista report shows 53.9% of ecommerce revenue was generated from mobile devices. Mobile optimization is vital for retailers. Easy mobile checkout and responsive design help drive mobile sales.
49. Larger photos increase sales by over 9%
(Source: Meero, 2023)
According to Meero, using larger product photos on ecommerce sites can increase sales by more than 9%. High-quality large images allow shoppers to see details and textures. This builds confidence to purchase the products.
Website Speed and Loading Time Statistics
Website speed is a critical component of user experience. Slow load times lead to poor engagement and lost revenue. The following statistics demonstrate the business impact of site speed.
50. 85% of pages load slower than 5 seconds
(Source: Unbounce, 2023)
Per Unbounce, 85% of web pages take longer than 5 seconds to load. 5 seconds is typically the limit for keeping a user’s attention. Most sites load too slowly, leading to bounce rates.
51. Nearly 50% refresh if the loading exceeds 3 seconds
(Source: Unbounce, 2023)
Additionally, from Unbounce, nearly 50% of users will refresh the page if it takes more than 3 seconds to load initially. Even small delays cause users to leave pages. Sites should aim for sub-3-second load times.
52. 70% less willing to buy from slow sites
(Source: Unbounce, 2023)
70% of consumers tell Unbounce that slow-loading web pages make them less willing to purchase from a company. Site speed has a direct impact on conversion rates and revenue.
53. Over 50% prefer fewer media for faster loads
(Source: Unbounce, 2023)
In a surprising Unbounce statistic, over 50% of users say they would prefer fewer media files on pages if it resulted in faster loading speeds. Users prioritize speed over rich media.
54. 50% longer sessions with 5-second loads
(Source: Unbounce, 2023)
Unbounce reports that websites loading within 5 seconds earn 50% longer user sessions on average. Faster sites lead to higher engagement metrics.
55. Slow loads increase cart abandonment by 29.8%
(Source: Unbounce, 2023)
Per Unbounce, a slow page load time can increase shopping cart abandonment rates by 29.8%. Customers expect fast and frictionless checkout experiences. Optimization is key for conversion.
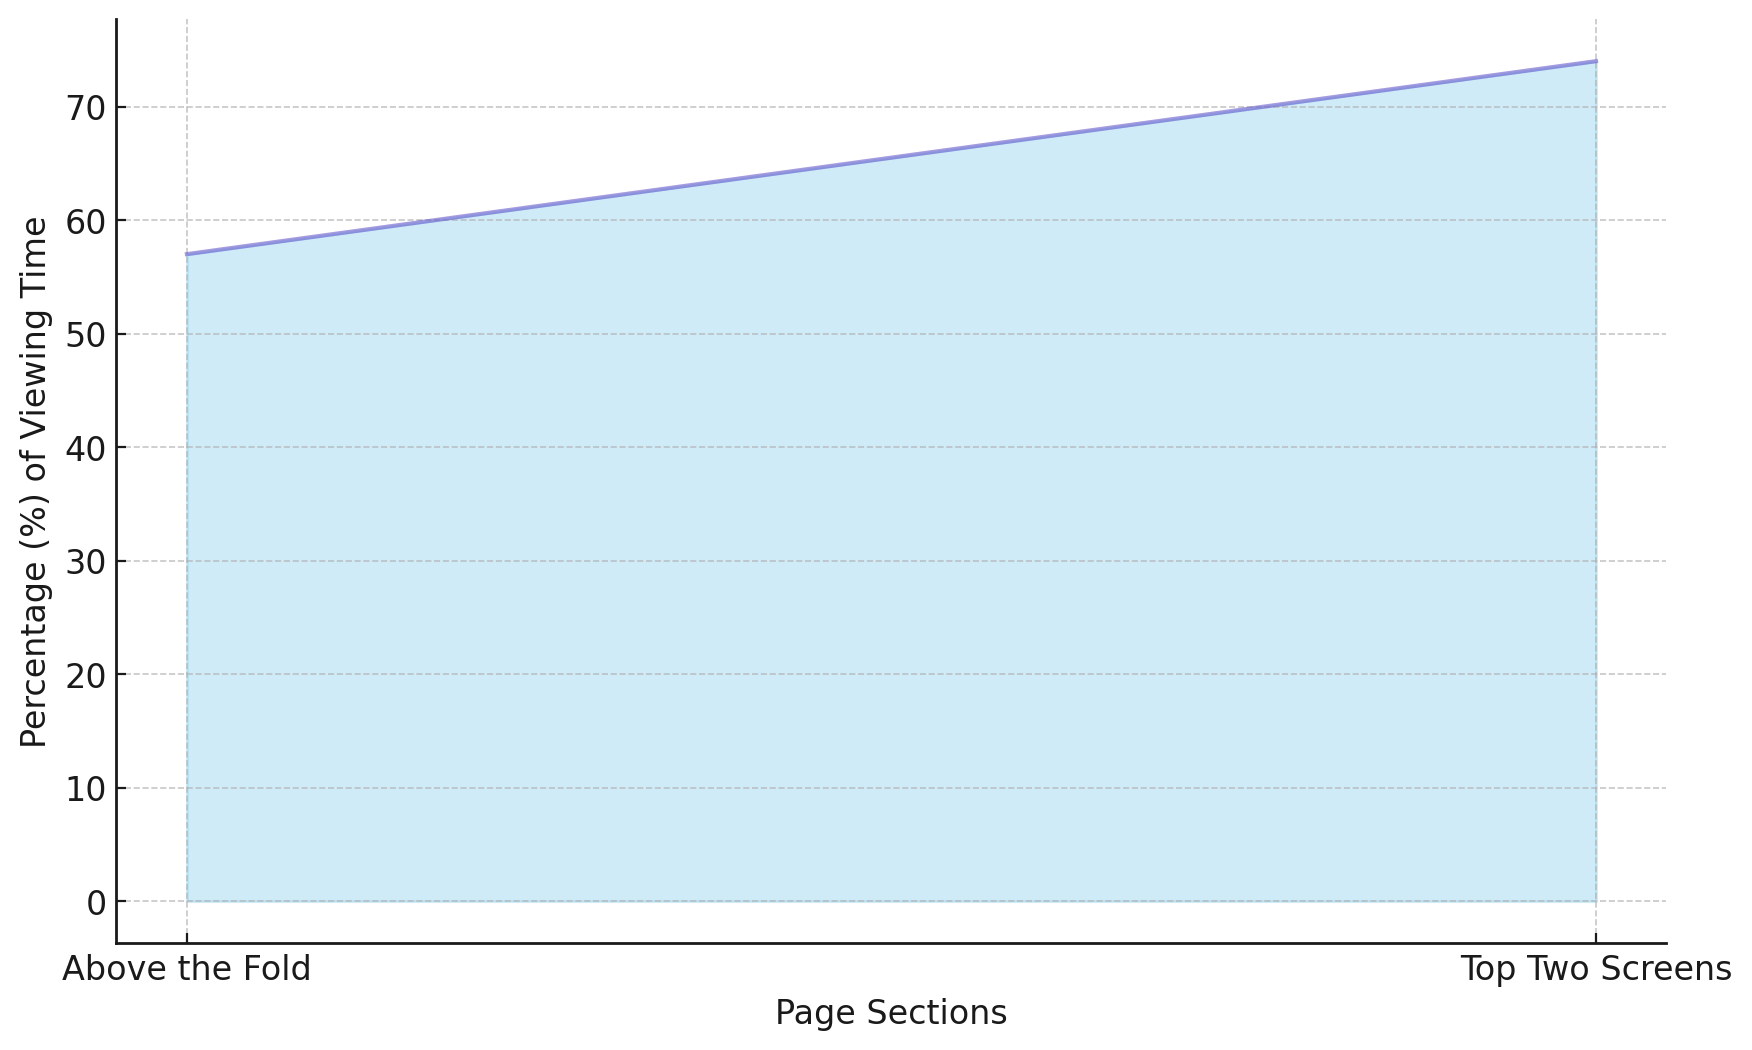
56. 57% of time spent above the fold, 74% on top screens
(Source: NNGroup, 2023)
An NNGroup report states users spend about 57% of page viewing time above the fold and 74% within the top two screens. Key content should be prioritized for above-the-fold placement.
57. The top site’s median load time is 10 seconds
(Source: Hootsuite, 2023)
The median load time for the top 500 ecommerce websites is 10 seconds, according to Hootsuite. While better than average, there is room for improvement compared to top performers.
58. Original photos see 35% higher conversions
(Source: CXL, 2023)
Per CXL, product and landing pages featuring original photos have almost 35% higher conversion rates than those using stock photos. Unique images build credibility and trust.
59. 123% higher bounce rate with 10-second loads
(Source: Unbounce, 2023)
If mobile page load times rise from 1 to 10 seconds, the bounce rate increases by 123% says Unbounce. Optimizing and testing on mobile is crucial to prevent abandonment.
Bonus: General Web Design Facts
Good website design makes sites easier to use and more enjoyable for visitors. Choices in layout, fonts, ads, and other areas impact how well visitors can find what they need. The stats below highlight key web design decisions and why they matter for keeping visitors happy.
60. Over half of visitors leave websites quickly
(Source: Unbounce, 2023)
Per Unbounce, bounce rates over 50% are typical on many websites. Identifying causes like slow pages and improving user experiences lifts retention. High bounce rates indicate issues turning visitors into engaged users. Sites should set benchmarks and test changes to better meet user expectations.
61. Most designers use sans-serif fonts
(Source: GoodFirms, 2023)
85% of designers use sans serif fonts like Open Sans on websites instead of decorative fonts. Sans serif fonts have simple shapes and no extra decorations. For text on screens, this makes them clean and easy to read. Visitors can quickly scan the pages to find what they need.
62. Pop-up ads make people block ads
(Source: Statista, 2023)
25% of people activate ad blockers because of intrusive pop-ups that disrupt browsing, per Statista. Rethinking promotional approaches respects users. Intrusive ads annoy users and drive them to install blockers. Sites should test less disruptive methods like banners to balance experience and revenue.
63. Parallax keeps visitors interested
(Source: MailMunch, 2022)
MailMunch reports adding parallax visual effects can lengthen average site session durations by over 90 seconds. The subtle motion intrigues visitors to linger. Parallax scrolling introduces dimension and visual interest to sites. The extra engagement signals high-quality experiential design.
64. Lawsuits target accessibility failures
(Source: Seyfarth, 2023)
Per Seyfarth, lawsuits alleging website accessibility failures under the ADA continue rising. Ensuring accommodations for disabled users avoids risks. Inaccessible sites limit access for users with disabilities. Ensuring compliance helps avoid lawsuits and builds inclusive experiences.
Keeping Up with the Future of Web Design
Web design is constantly evolving, and it is important to stay ahead of the curve to ensure success in the future. Here are a few key points to consider when preparing for the future of web design:
- Stay updated with technology: The web design landscape changes rapidly, with new technologies and trends emerging all the time. It’s crucial to stay informed and updated about new tools, frameworks, and coding languages to create modern and innovative designs.
- Responsive design: With the increasing use of mobile devices, responsive design has become essential. Designing websites that adapt seamlessly to different screen sizes and orientations will ensure a positive user experience across various devices.
- User-centric approach: Designing for the user should always be the primary focus. Understanding user needs, behaviors, and preferences will help create intuitive and engaging web experiences. Conducting user testing and gathering feedback is pivotal in improving and optimizing design choices.
- Accessibility and inclusivity: Web accessibility is gaining importance, as it ensures that websites are usable by people with disabilities. Designing with accessibility in mind improves usability for all users. Inclusivity should be considered in color choices, font sizes, and other design elements, ensuring a broader reach and positive user experience for everyone.
- Performance optimization: Website speed is crucial for user satisfaction and search engine rankings. Optimize images, minimize code, use caching techniques, and follow best practices to achieve faster load times. Paying attention to performance from the start will make your designs more successful.
- Embrace visual storytelling: The future of web design is moving towards immersive experiences and engaging storytelling. Incorporate visually appealing elements like interactive graphics, animations, and videos to create captivating narratives and convey your message effectively.
- Continuous learning: The field of web design is ever-evolving, so it’s essential to have a mindset of continuous learning. Stay curious, explore new design trends, experiment with different techniques, and keep improving your skills to stay competitive.
By following these guidelines and keeping an eye on emerging trends, you can effectively prepare yourself for the future of web design and deliver impactful experiences for users in the digital domain.
Summary
The web design world keeps changing. As the statistics we looked at show, trends come and go. But some basics stay the same. Simplicity and clarity are still key – messy and complex sites often do poorly.
Mobile optimization is essential, with over 60% of web traffic now coming from phones and tablets. How fast a site loads matters more than ever. 53% of mobile users leave sites that take over 3 seconds to load.
Looking ahead, web accessibility and inclusive design will become more important. The need for responsible, ethical design will also get more focus. Most importantly, understanding what users need through analytics and testing is crucial to making sites that successfully engage audiences.
By keeping these learnings in mind and staying up-to-date on new trends, web designers can build effective sites ready for the future. As the web advances, focusing on users must remain the guiding star for all our work.
FAQs
Why is web design important in statistics?
Web design is important in statistics for several reasons:
1. Data Visualization: Web design helps present statistical information in an aesthetically pleasing and intuitive manner. By using appropriate visual elements such as charts, graphs, and infographics, statistical data becomes more easily understandable and accessible to a wider audience.
2. User Experience: Good web design ensures that statistical information is presented in a user-friendly way. It helps users navigate through the data, interact with different elements, and find the information they need efficiently. This enhances the overall user experience and increases engagement with statistical content.
3. Credibility and Trust: Well-designed websites that showcase statistics professionally and accurately contribute to the credibility and trustworthiness of the information being presented. A visually appealing design inspires confidence in the data and can reinforce the message being conveyed.
What is the growth rate of web design?
The growth rate of web design can vary over time based on market demand, technological advancements, and evolving design trends. While specific growth rates can be difficult to measure precisely, web design has experienced significant growth in recent years due to the expanding digital landscape. The increasing reliance on websites for businesses, e-commerce, content delivery, and information dissemination has fueled the growth of web design. With the continuous development of new technologies and the increasing importance of online presence, the demand for web design is expected to remain strong.
The statement that “94% of first impressions of a website design are related to WebFX” does not seem accurate. It is unlikely that a single source, such as WebFX, would account for such a high percentage of first impressions. First impressions are formed based on various factors such as visual appeal, functionality, user experience, and content quality. While WebFX may be a reputable source for web design information, it is essential to consider the broader context and multiple sources to make accurate claims about the impact of a website’s design on first impressions.
Is web design still in demand?
Yes, web design is still in high demand and continues to be an essential aspect of the digital landscape. As businesses and individuals increasingly rely on websites for various purposes, the need for well-designed and visually appealing digital platforms has grown. Web design encompasses not only aesthetics but also user experience, accessibility, and functionality, making it a crucial component of successful websites. The demand for web design professionals remains strong as companies and organizations strive to create engaging online experiences, optimize conversions, and maintain a competitive online presence.